
Titanic Kaggle Competition
Published:
I decided to go through the Introduction to Machine Learning course on my younger brother’s Code Academy account. Thanks Josh!

Some of the things I learned in the course included Linear and Logistic Regression, Decision Trees, K-Nearest Neighbours, K-Means(++) Clustering and the building blocks of deep learning, Perceptrons.
One of the course’s projects was to make a submission to Kaggle’s Titanic competition. After going through the course, I decided to comeback to this project and add to it more of what I learned during the course. Check out the actual submission notebook on Kaggle.com here.
Titanic Competition
In this notebook we’re gonna use multiple types of training models to try and find the best predictor of which passengers will survive the Titanic disaster based on data.
import pandas as pd
import numpy as np
import matplotlib.pyplot as plt
from sklearn import linear_model
from sklearn.neighbors import KNeighborsClassifier
from sklearn.ensemble import RandomForestClassifier
from sklearn.linear_model import Perceptron
Analysis of the Data
# Displaying the data
df_train = pd.read_csv("../input/titanic/train.csv")
df_train.head()
| PassengerId | Survived | Pclass | Name | Sex | Age | SibSp | Parch | Ticket | Fare | Cabin | Embarked | |
|---|---|---|---|---|---|---|---|---|---|---|---|---|
| 0 | 1 | 0 | 3 | Braund, Mr. Owen Harris | male | 22.0 | 1 | 0 | A/5 21171 | 7.2500 | NaN | S |
| 1 | 2 | 1 | 1 | Cumings, Mrs. John Bradley (Florence Briggs Th... | female | 38.0 | 1 | 0 | PC 17599 | 71.2833 | C85 | C |
| 2 | 3 | 1 | 3 | Heikkinen, Miss. Laina | female | 26.0 | 0 | 0 | STON/O2. 3101282 | 7.9250 | NaN | S |
| 3 | 4 | 1 | 1 | Futrelle, Mrs. Jacques Heath (Lily May Peel) | female | 35.0 | 1 | 0 | 113803 | 53.1000 | C123 | S |
| 4 | 5 | 0 | 3 | Allen, Mr. William Henry | male | 35.0 | 0 | 0 | 373450 | 8.0500 | NaN | S |
df_train.describe(include='all')
| PassengerId | Survived | Pclass | Name | Sex | Age | SibSp | Parch | Ticket | Fare | Cabin | Embarked | |
|---|---|---|---|---|---|---|---|---|---|---|---|---|
| count | 891.000000 | 891.000000 | 891.000000 | 891 | 891 | 714.000000 | 891.000000 | 891.000000 | 891 | 891.000000 | 204 | 889 |
| unique | NaN | NaN | NaN | 891 | 2 | NaN | NaN | NaN | 681 | NaN | 147 | 3 |
| top | NaN | NaN | NaN | Becker, Miss. Marion Louise | male | NaN | NaN | NaN | 347082 | NaN | B96 B98 | S |
| freq | NaN | NaN | NaN | 1 | 577 | NaN | NaN | NaN | 7 | NaN | 4 | 644 |
| mean | 446.000000 | 0.383838 | 2.308642 | NaN | NaN | 29.699118 | 0.523008 | 0.381594 | NaN | 32.204208 | NaN | NaN |
| std | 257.353842 | 0.486592 | 0.836071 | NaN | NaN | 14.526497 | 1.102743 | 0.806057 | NaN | 49.693429 | NaN | NaN |
| min | 1.000000 | 0.000000 | 1.000000 | NaN | NaN | 0.420000 | 0.000000 | 0.000000 | NaN | 0.000000 | NaN | NaN |
| 25% | 223.500000 | 0.000000 | 2.000000 | NaN | NaN | 20.125000 | 0.000000 | 0.000000 | NaN | 7.910400 | NaN | NaN |
| 50% | 446.000000 | 0.000000 | 3.000000 | NaN | NaN | 28.000000 | 0.000000 | 0.000000 | NaN | 14.454200 | NaN | NaN |
| 75% | 668.500000 | 1.000000 | 3.000000 | NaN | NaN | 38.000000 | 1.000000 | 0.000000 | NaN | 31.000000 | NaN | NaN |
| max | 891.000000 | 1.000000 | 3.000000 | NaN | NaN | 80.000000 | 8.000000 | 6.000000 | NaN | 512.329200 | NaN | NaN |
Going through each feature and making an initial analysis/assumption on their correlation and if we should use them for training the model. Additionally if the data itself needs to be cleaned at all.
- PassengerID:
- Not correlated to survival, will not be used in training.
- Pclass:
- It is likely that passengers of ‘higher class’ were prioritized during the disaster. Luckily the values of the passenger class data is categorized into numerical buckets and there aren’t any missing values.
- Sex:
- Women and children were prioritized so this will likely be an important feature for training.
- Name:
- It is unlikely that name will be useful compared to passenger class. We could possibly group by title or by last name, but the Sex field already has a similar function without having to clean the data and classifying based on the names we train on would be overfitting the model.
- Age:
- Since women and children were prioritized during the rescue, this is definitely a category we will want to look at. Some values are missing so that will have to be cleaned. We may want to explore bucketing the Age field into age groups.
- SibSp / Parch:
- If we add these together it will get the size of your family that was onboard, it’s possible that this could be correlated to survival.
- Ticket:
- There are too many missing values in ticket, this field will not be used.
- Fare:
- The fare is correlated with class of the passenger. Since this is the case we will choose the pclass feature.
- Cabin:
- Again is missing too many values. Will be dropped.
- Embarked:
- Passengers on the ship may have had their quarters located based on when they embarked in addition to pclass. This may affect their survival rate. The correlation for this category will be explored.
# Analyzing Passenger Class
df_train[['Pclass', 'Survived']].groupby(['Pclass'], as_index=False).mean()
| Pclass | Survived | |
|---|---|---|
| 0 | 1 | 0.629630 |
| 1 | 2 | 0.472826 |
| 2 | 3 | 0.242363 |
# Analyzing Sex
df_train[['Sex', 'Survived']].groupby(['Sex'], as_index=False).mean()
| Sex | Survived | |
|---|---|---|
| 0 | female | 0.742038 |
| 1 | male | 0.188908 |
# Analyzing Age
df_train["Agebucket"] = pd.cut(df_train['Age'], 8)
age_analysis_df = df_train[['Agebucket', 'Survived']].groupby(['Agebucket'], as_index=False).mean()
age_analysis_df.plot(x='Agebucket', y='Survived', style='o', figsize=(15,5))
<matplotlib.axes._subplots.AxesSubplot at 0x7fc574ffe128>
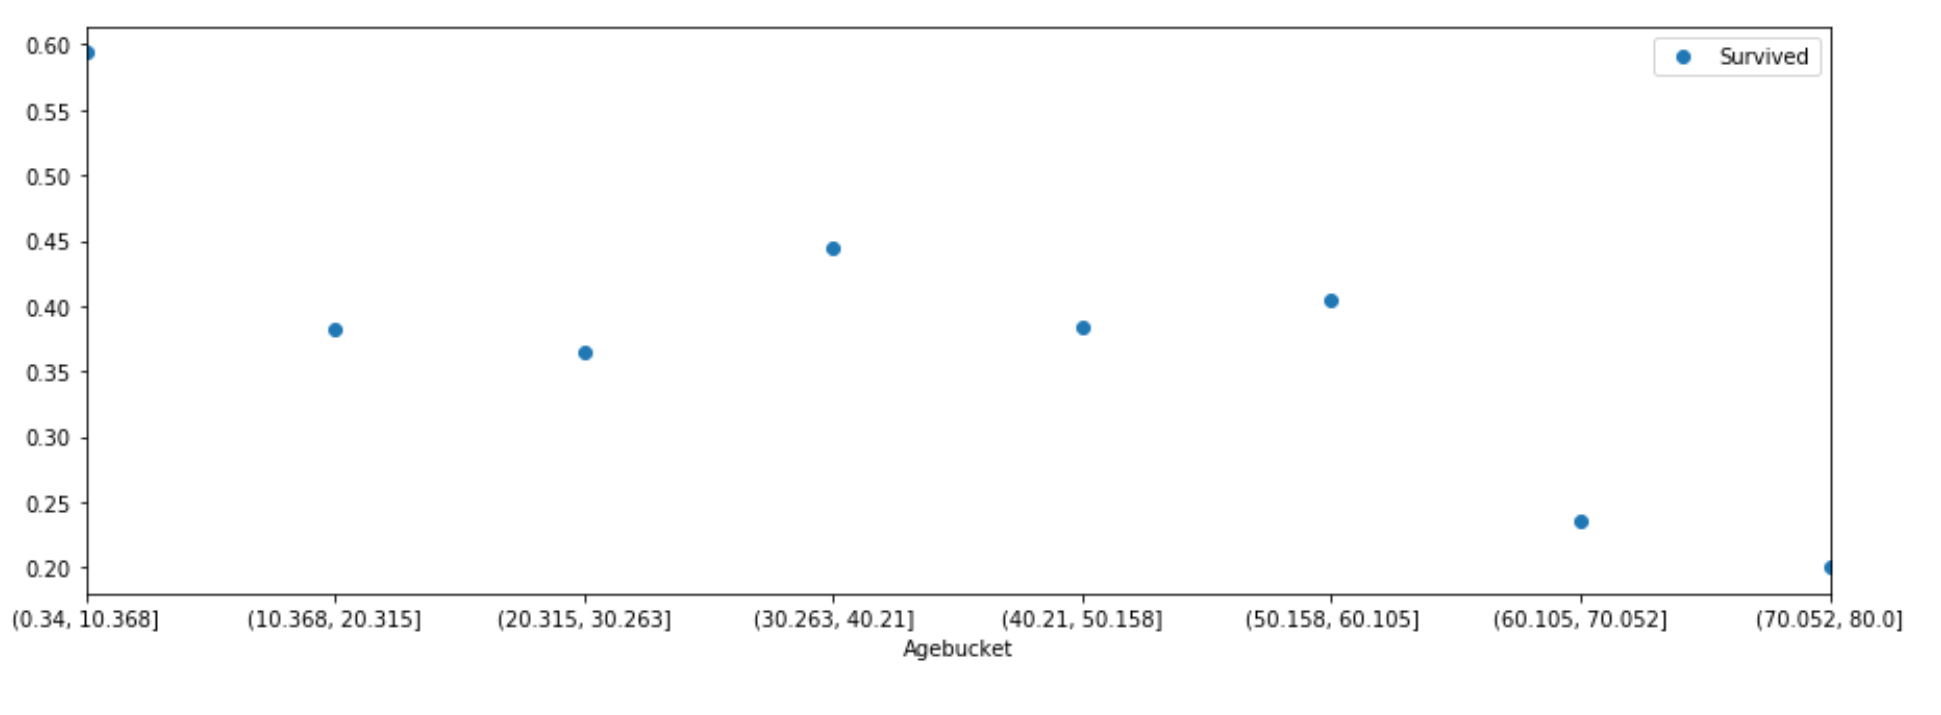
For age we can see that the younger demographic, especially under 10 years old had a better chance of surviving than the other age ranges. Note that since there were few older passengers the mean value is very volitile. Thus the large drop at after 60 years old can be discounted due to lack of data.
df_train[['Agebucket', 'Survived']].groupby(['Agebucket'], as_index=False).mean()
| Agebucket | Survived | |
|---|---|---|
| 0 | (0.34, 10.368] | 0.593750 |
| 1 | (10.368, 20.315] | 0.382609 |
| 2 | (20.315, 30.263] | 0.365217 |
| 3 | (30.263, 40.21] | 0.445161 |
| 4 | (40.21, 50.158] | 0.383721 |
| 5 | (50.158, 60.105] | 0.404762 |
| 6 | (60.105, 70.052] | 0.235294 |
| 7 | (70.052, 80.0] | 0.200000 |
# Analyzing Family Size
df_train['FamilySize'] = df_train['SibSp'] + df_train['Parch'] + 1
df_train[['FamilySize', 'Survived']].groupby(['FamilySize'], as_index=False).mean()
| FamilySize | Survived | |
|---|---|---|
| 0 | 1 | 0.303538 |
| 1 | 2 | 0.552795 |
| 2 | 3 | 0.578431 |
| 3 | 4 | 0.724138 |
| 4 | 5 | 0.200000 |
| 5 | 6 | 0.136364 |
| 6 | 7 | 0.333333 |
| 7 | 8 | 0.000000 |
| 8 | 11 | 0.000000 |
Here the most significant correlation is that having no family member aboard negatively correlates with survival. We can just include this in the training.
# Analyzing Embarked
df_train[['Embarked', 'Survived']].groupby(['Embarked'], as_index=False).mean()
| Embarked | Survived | |
|---|---|---|
| 0 | C | 0.553571 |
| 1 | Q | 0.389610 |
| 2 | S | 0.336957 |
There is enough of a discrepancy between where peple embarked where we can use this as a feature in training.
Cleaning the Data for Training
def clean_data(training_dataset):
    training_dataset["FirstClass"] = training_dataset["Pclass"].apply(lambda x: 1 if x == 1 else 0)
    training_dataset["SecondClass"] = training_dataset["Pclass"].apply(lambda x: 1 if x == 2 else 0)
    training_dataset["ThirdClass"] = training_dataset["Pclass"].apply(lambda x: 1 if x == 3 else 0)
    training_dataset["SexNum"] = training_dataset["Sex"].map({"male":"0", "female":"1"})
    training_dataset["isChild"] = training_dataset["Age"].apply(lambda x: 1 if x != None and x <= 10 else 0)
    training_dataset['FamilySize'] = training_dataset['SibSp'] + df_train['Parch'] + 1
    training_dataset["embarkedCherbourg"] = training_dataset["Embarked"].apply(lambda x: 1 if x == "C" else 0)
    return training_dataset[["SexNum", "isChild", "FirstClass", "SecondClass", "ThirdClass", "embarkedCherbourg"]]
# Training Data and Labels
features = clean_data(df_train)
survived = df_train[["Survived"]]
# Train using different types of classifiers.
classifiers = {
    "Logistic Regression" : linear_model.LogisticRegression(),
    "K-Nearest Neighbours" : KNeighborsClassifier(2),
    "Random Forest" : RandomForestClassifier(),
    "Perceptron" : Perceptron()
}

for classifier_name, classifier in classifiers.items():
    model = classifier
    model.fit(features, survived.values.ravel())
    print(classifier_name, model.score(features, survived))
Logistic Regression 0.7901234567901234
K-Nearest Neighbours 0.8035914702581369
Random Forest 0.8092031425364759
Perceptron 0.6644219977553311
# Cleaning the test data using the best classifier.
df_test = pd.read_csv("../input/titanic/test.csv")
test_data = clean_data(df_test)
model = RandomForestClassifier()
model.fit(features, survived.values.ravel())
test_data.head()
| SexNum | isChild | FirstClass | SecondClass | ThirdClass | embarkedCherbourg | |
|---|---|---|---|---|---|---|
| 0 | 0 | 0 | 0 | 0 | 1 | 0 |
| 1 | 1 | 0 | 0 | 0 | 1 | 0 |
| 2 | 0 | 0 | 0 | 1 | 0 | 0 |
| 3 | 0 | 0 | 0 | 0 | 1 | 0 |
| 4 | 1 | 0 | 0 | 0 | 1 | 0 |
prediction = np.array([df_test["PassengerId"].values, model.predict(test_data)])
results = pd.DataFrame({'PassengerId': prediction[0, :], 'Survived': prediction[1, :]})
results.to_csv("submission.csv", index=False)